
/Market Gap
What if short-term rental operators had a financial tool actually built for them?
Short-term rental operators have real tax advantages available to them, but only if their finances are precise. Most were stuck doing manual data entry or handing their accountant a pile of bank statements and hoping for the best. Existing tools were too generic for STR finances or too complex for a solo operator. Nobody had built something specifically for this person.
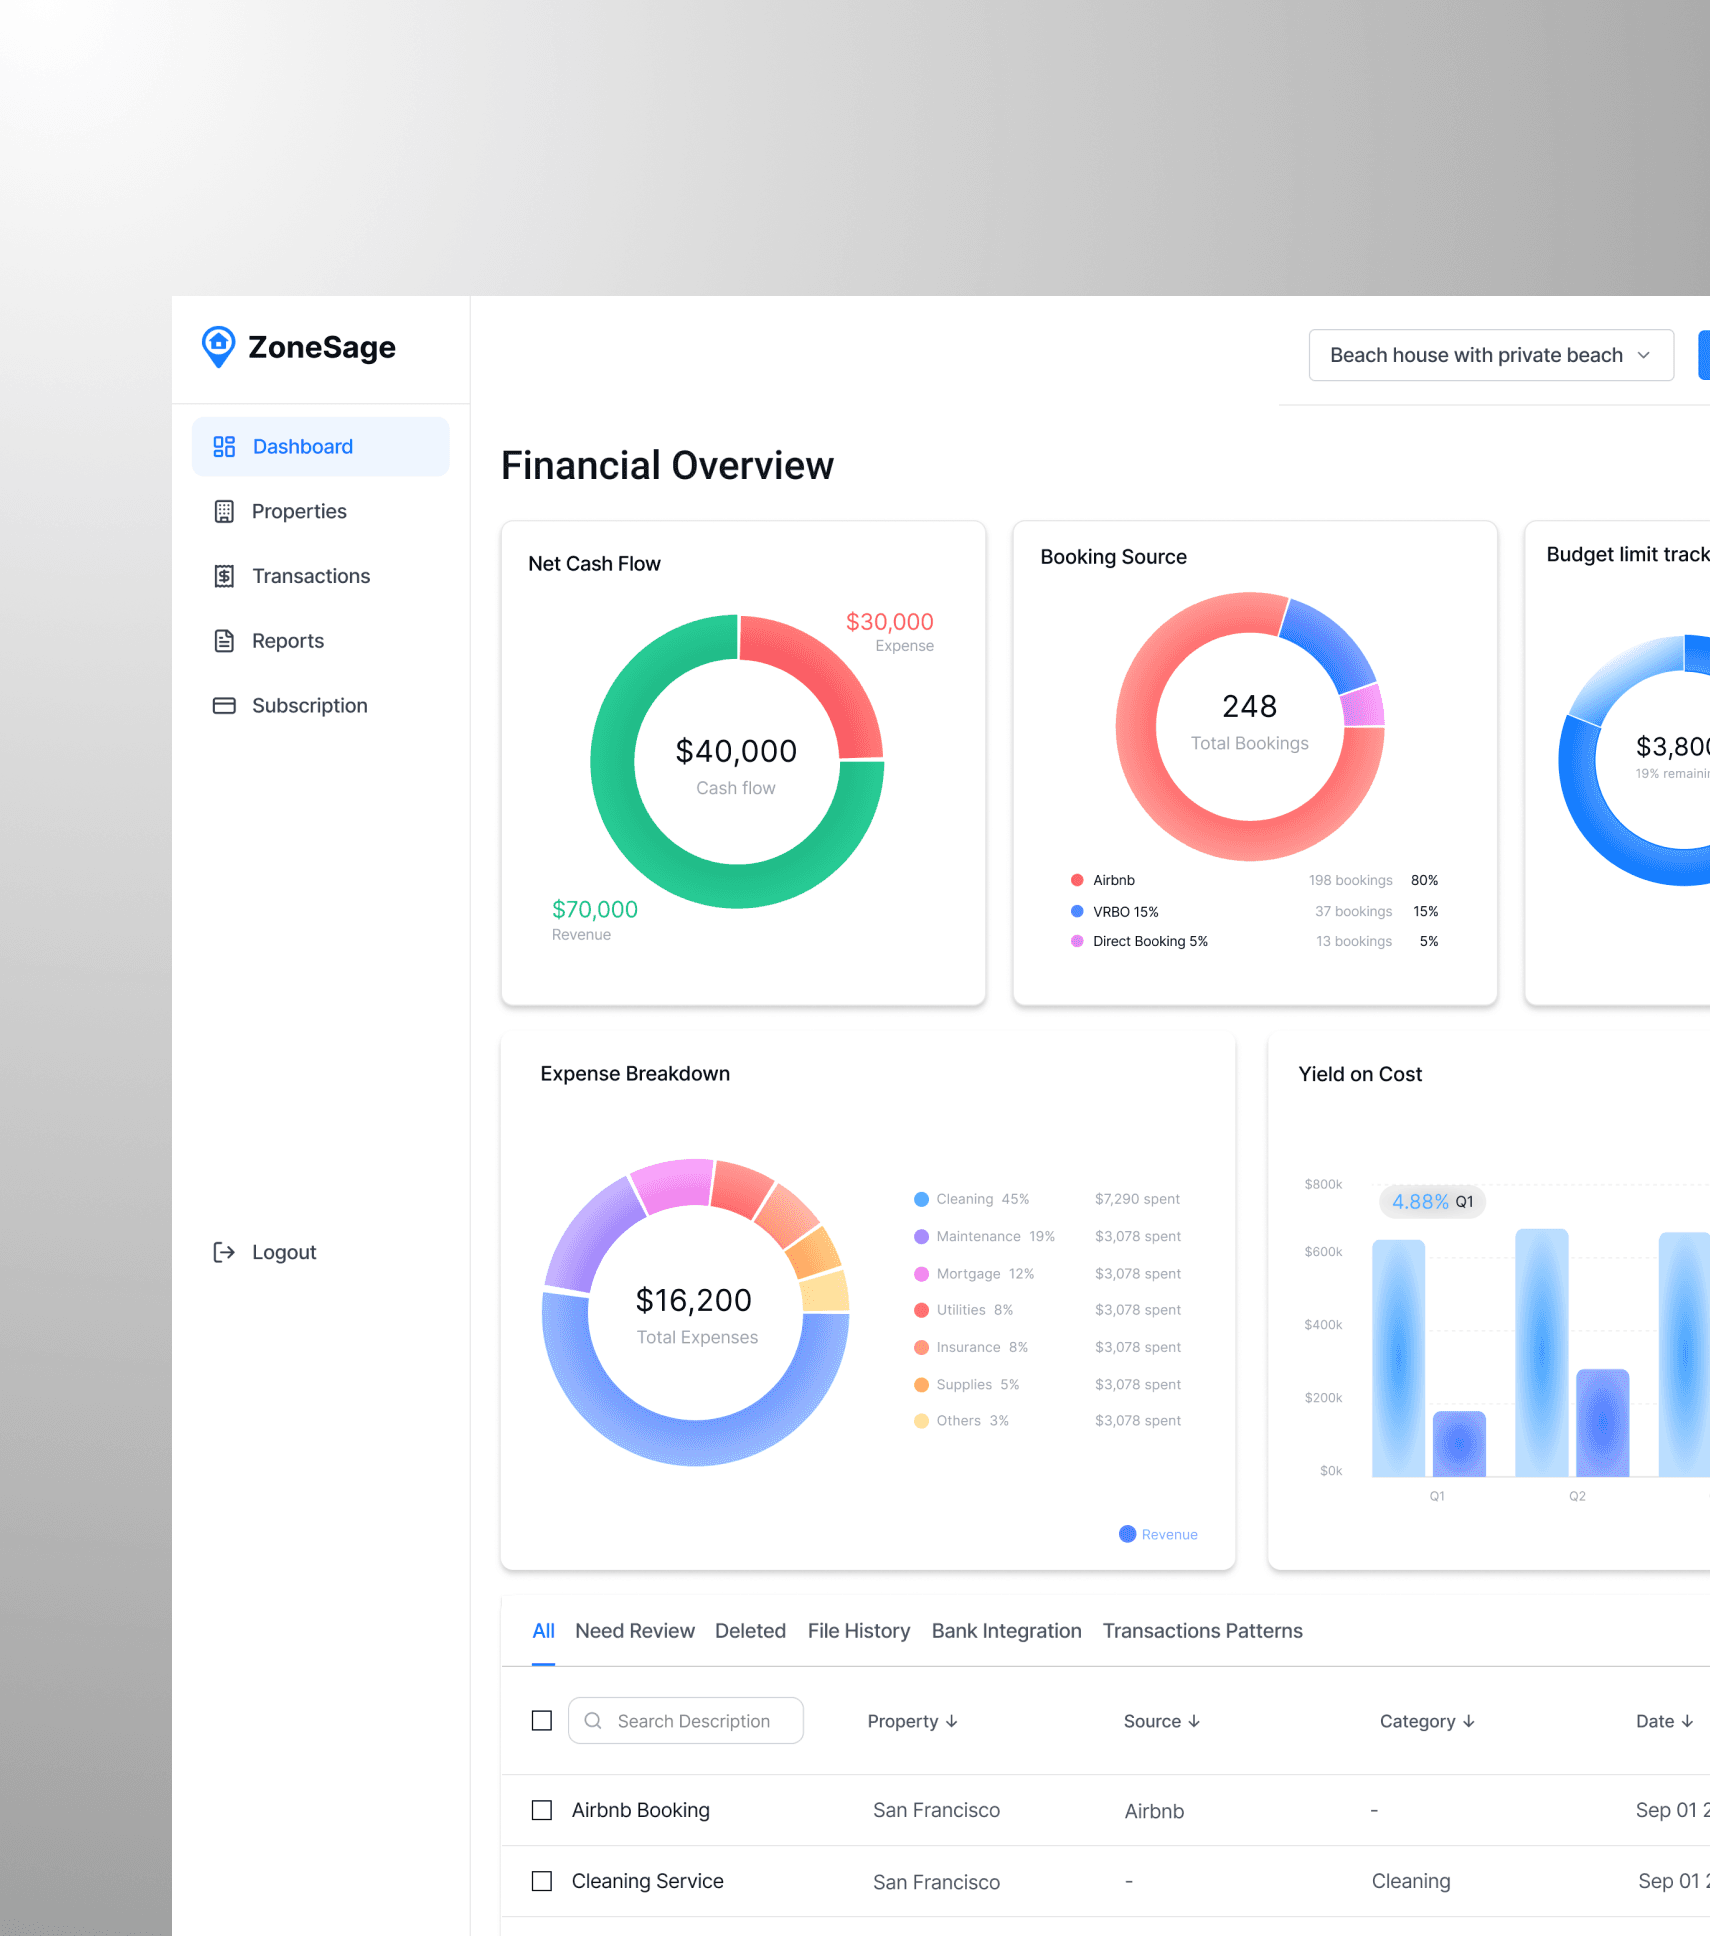
/Solution
ZoneSage: A transaction tracking platform purpose-built for short-term rental operators
ZoneSage ingests transactions from property management systems, bank statements, and historical CSV imports, automatically categorized in the All Transactions view, flagged for operator review in Needs Review, and compiled into a tax-ready P&L report for your accountant.
/User Needs Research Findings
Operators were stuck between tools that were too complex and processes that were too manual.
We reached out to short-term rental operators through cold calls and direct messages to understand how they were managing their finances. After hundreds of conversations, the problem was clear. Operators were manually entering transactions into Excel every month because setting up property-level classes in tools like QuickBooks was too complex. That same spreadsheet was what they handed their accountant.
They wanted a system that:

Automate manual transaction tracking

Track revenue from property management platforms

Support accountant review and validation
Import and reconcile historical records
/Domain research
STR finances don't work like generic accounting
Fulfilling what operators needed required understanding a domain most tools get wrong. Every transaction has to be attributed to a specific property, tagged to the right tax category, and treated differently depending on its source.
I worked with accountants and engineers to map the most common transaction rules before designing anything. That work became the interpretation layer the entire product was built on.


/Design Approach
Designing Around a Four-Stage Flow
Once we understood the domain, the product structure became clear. Every operator interaction maps to one of four stages: connect your properties, ingest transactions from every source, categorize and attribute automatically, and surface results operators can trust.
The complexity lives in the third stage. How the system interprets and attributes data determines what operators see and whether they trust it. That's where the design decisions mattered most."

Connect your property portfolio

Ingest transactions from every source
Categorize and attribute automatically
Surface results operators can trust
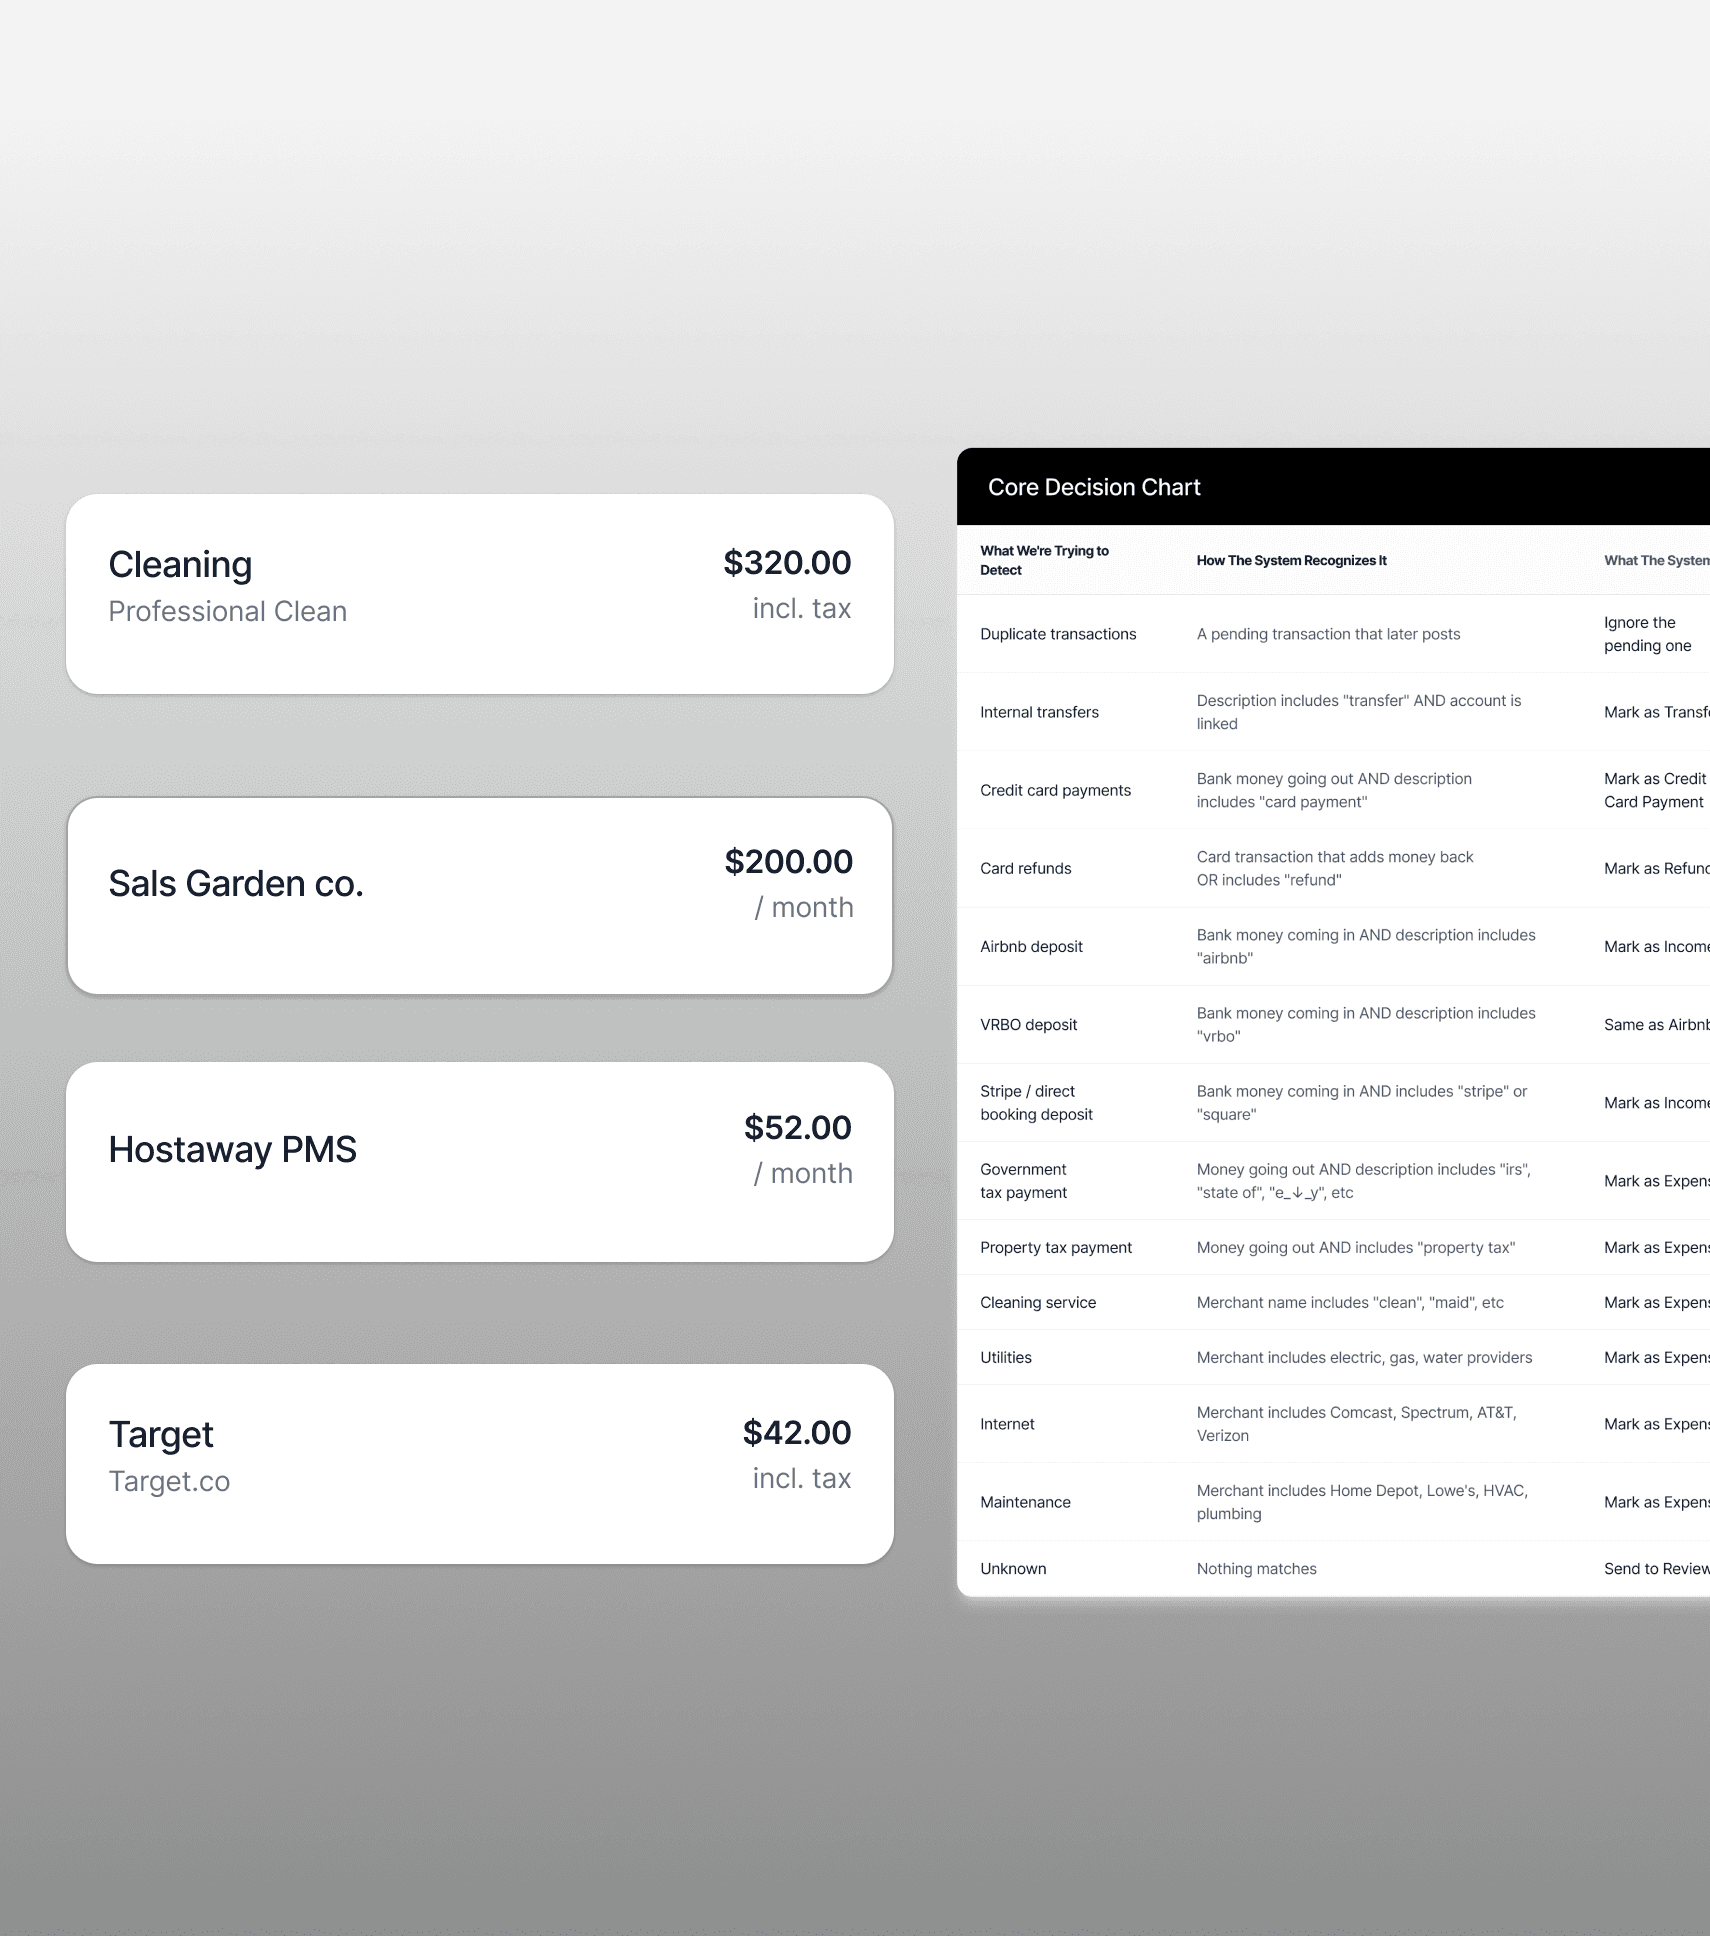
/Key design decision
Where trust actually formed
The system couldn't be certain about every transaction. Rather than hiding that uncertainty behind silent automation, we made it visible. Operators could see exactly how each transaction was interpreted, why the system wasn't confident, and confirm the outcome.
Every confirmation taught the system. A vendor mapped once would be recognized automatically the next time, attributed to the right property, assigned the right category. The more operators engaged, the less manual work remained.

Flagged transactions show why the system wasn't confident, not just that it wasn't.
/Iterations
Addressing user feedback
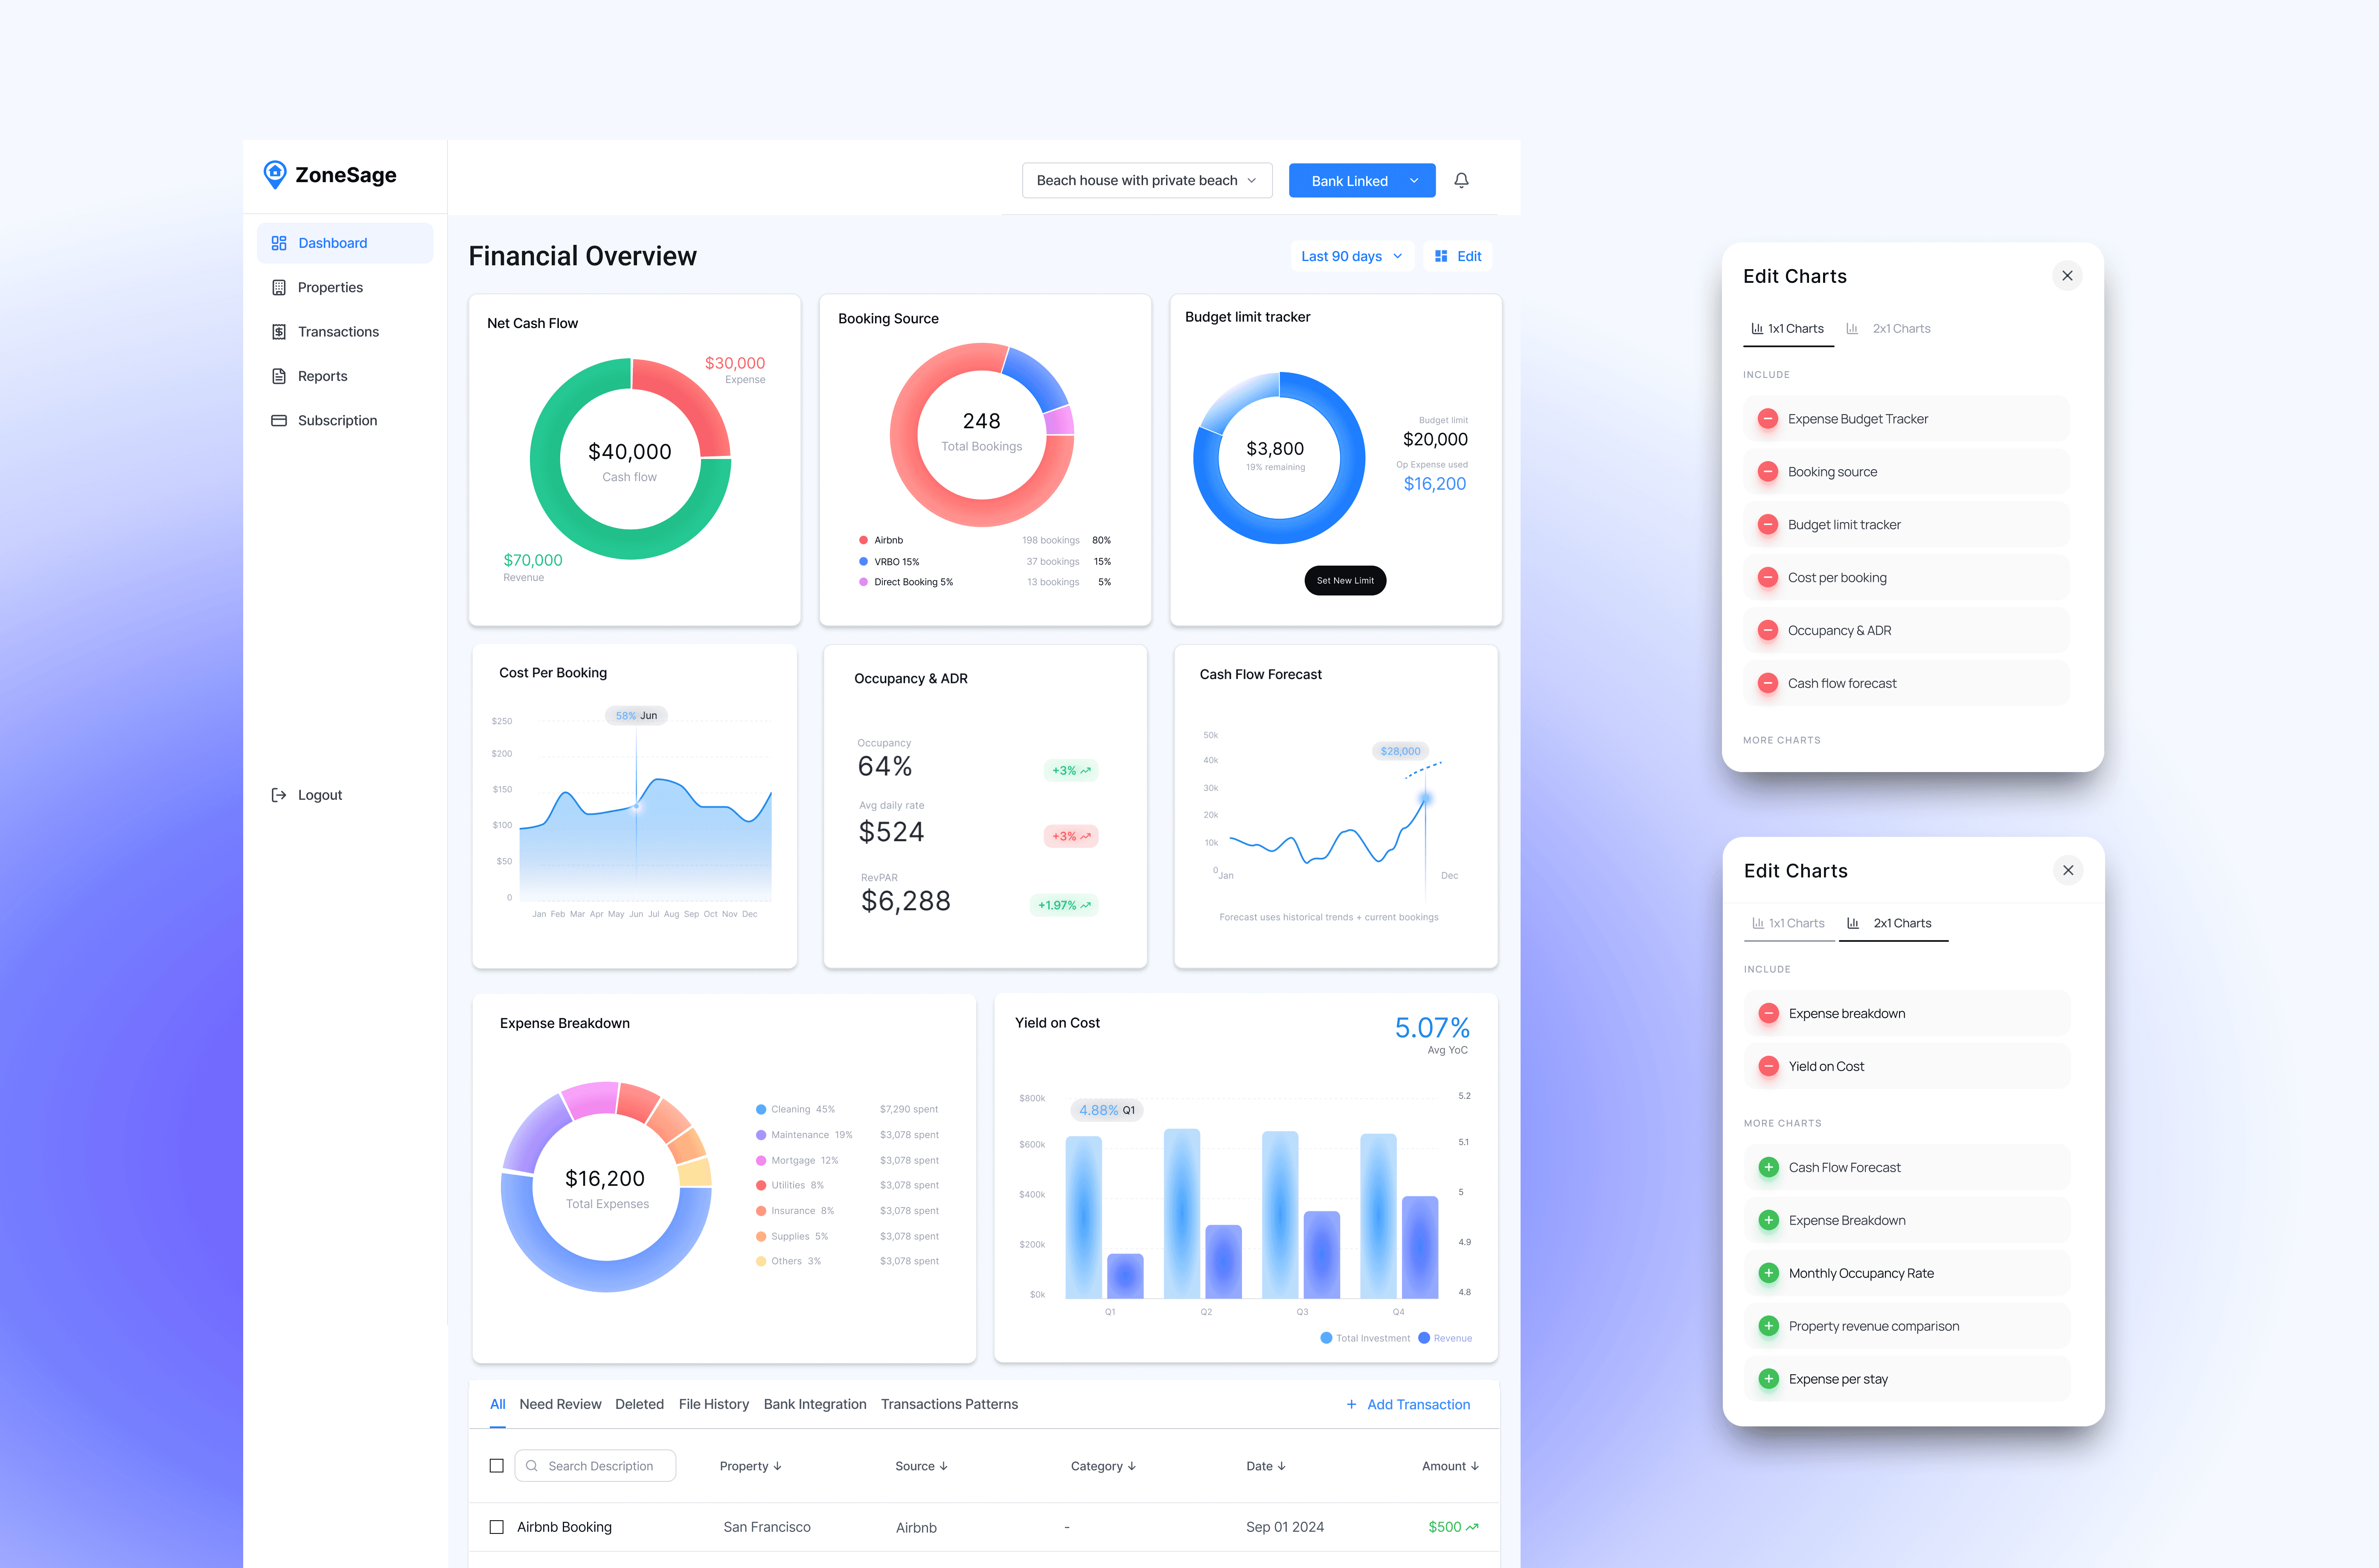
As we shipped core functionality and moved toward new features, we noticed how much inconsistency had accumulated from moving quickly. Spacing, corners, and component styles had never been formally defined and it showed. Before tackling anything new we addressed it.
At the same time operators at different scales were asking for different things from the dashboard, so we gave them control over which metrics to surface. A tool handling someone's finances needs to feel both trustworthy and built for them specifically.
/Reflection
